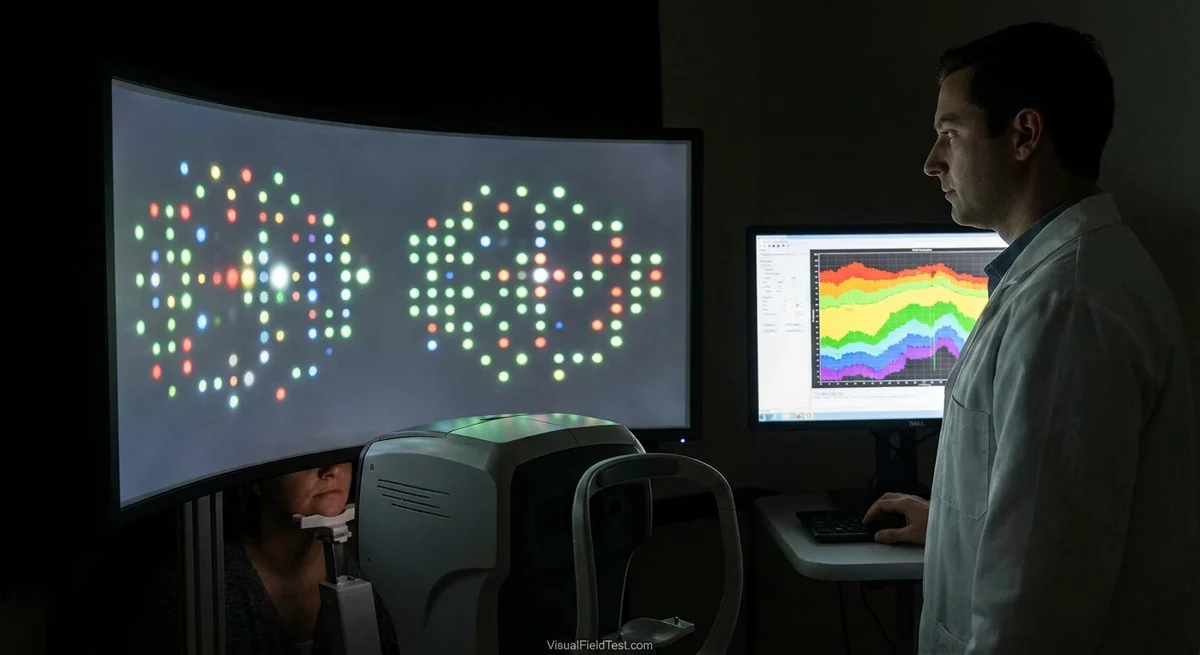
Introduction
Vision relies on many kinds of retinal ganglion cells (RGCs), each tuned to different color or contrast signals. Standard visual field tests use white-on-white (achromatic) stimuli and measure overall sensitivity, but early or selective damage in diseases like glaucoma can hide behind normal full-field results. Specialized perimetry tests now probe specific pathways by using color or temporal contrast stimuli. For example, blue-on-yellow perimetry (Short-Wavelength Automated Perimetry, SWAP) presents a bright blue target on a yellow background to isolate the short-wavelength (blue) cone pathway and its small bistratified RGCs (pmc.ncbi.nlm.nih.gov). Similarly, red–green (chromatic) tests aim at the long-/medium-wavelength cone pathways (parvocellular system), and flicker/temporal tests (like frequency-doubling perimetry or high-frequency flicker) stress the large parasol (magnocellular) RGCs. By dissecting vision in this way, clinicians hope to catch damage in specific RGC subtypes earlier or more precisely than with white-on-white testing.
This article reviews these color- and contrast-specific perimetry methods and how they relate to glaucoma and optic nerve disease. We discuss what blue-yellow and red-green perimetry can reveal about pathway dysfunction, how flicker perimetry examines temporal contrast processing, and how these functional losses map onto structural imaging (OCT) and blood flow metrics (OCT-Angiography). We also consider evidence on whether such targeted tests predict later decline on standard fields, and suggest practical testing protocols that maximize diagnostic insight without overly straining patients.
Color- and Contrast-Specific Perimetry
Blue–Yellow (SWAP) Perimetry
Blue-on-yellow perimetry (SWAP) is a well-known color test. It uses a large, narrowband blue stimulus (around 440 nm) presented on a bright yellow background (pmc.ncbi.nlm.nih.gov). The high-luminance yellow field adapts the red and green cones so that the remaining pathway – the short-wavelength (blue) cones and their small bistratified RGCs – respond mainly. In effect, SWAP “isolates” the blue-cone channel. Early glaucoma often affects these small bistratified cells, so SWAP can reveal field loss sooner than conventional testing (pmc.ncbi.nlm.nih.gov). Indeed, studies report SWAP can detect visual field defects in glaucoma suspects or early glaucoma eyes before standard perimetry shows losses, suggesting higher sensitivity for early damage (pmc.ncbi.nlm.nih.gov) (pmc.ncbi.nlm.nih.gov). For example, one study found SWAP deficits strongly correlated with retinal nerve fiber thinning (r≈0.56 in the inferior quadrant) in glaucoma patients (pmc.ncbi.nlm.nih.gov), indicating SWAP loss matches structural damage.
However, SWAP has practical limitations. It is sensitive to lens opacity (cataracts make results unreliable) and generally requires longer testing (to overcome adaptation effects). Clinically, SWAP often uses a “SITA-SWAP” algorithm to shorten time, but patients may still fatigue easily. In research, SWAP fields have shown greater mean deficits than white-on-white fields in glaucoma suspects (pmc.ncbi.nlm.nih.gov) (pmc.ncbi.nlm.nih.gov), but reproducibility can be an issue. Another SWAP-based approach measures pupil responses (pupillography) to blue vs yellow stimuli, reflecting melanopsin ganglion cell function. One study found blue-light pupillary tests detected early loss slightly better than yellow-light stimuli in mild glaucoma, hinting that blue pathway testing may reveal early damage (openresearch-repository.anu.edu.au).
Given SWAP’s strengths and weaknesses, it is mainly used when clinicians suspect early glaucoma or optic neuropathy despite normal standard fields. Many glaucoma specialists run a blue-on-yellow Swedish Interactive Threshold Algorithm (SITA SWAP) in suspicious cases.
Red–Green (Parvocellular) Perimetry
The red–green pathway (parvocellular system) carries high-resolution and color-opponent signals and can also be tested psychophysically. In practice, isolating this channel requires careful design (often using isoluminant red vs green stimuli). There is no widely used commercial “red–green perimetry,” but research tests have shown interesting findings. For example, studies using red–green opponency testing have found that in some glaucomatous eyes the parvocellular pathway is as vulnerable – or even more vulnerable – than the achromatic pathway. One classic study found that a subset of early glaucoma eyes had larger losses for red–green color contrast than for white-on-white vision (www.sciencedirect.com). This suggests that parvocellular (L/M cone) ganglion cells can be selectively damaged. In that study, red–green contrast thresholds in some patients were unexpectedly worse than predicted by overall sensitivity, implying a departure from the usual assumption that large, magnocellular fibers would show equal or greater loss (www.sciencedirect.com).
Because true isoluminant red–green perimetry is complex, some clinics have tried simpler variants. For instance, a “green-on-yellow” test (using a green target on yellow background) mimics a red–green contrast test with the yellow background suppressing blue cones. A recent study showed that green-on-yellow fields agreed well with traditional blue-on-yellow fields, with similar sensitivity and specificity for glaucoma detection (pmc.ncbi.nlm.nih.gov). In practice, this means clinicians can probe parvocellular function by switching stimulus wavelength, but with current equipment this is uncommon. However, it highlights that color-opponent deficits (both red–green and blue–yellow) provide complementary information: SWAP tests the koniocellular (S-cone) route, and a green/yellow test probes the L/M (parvo) route.
Temporal (Flicker) Contrast Perimetry
Temporal contrast sensitivity – the ability to detect rapid flicker or motion – is largely carried by the magnocellular (M-cell) pathway. Tests that measure flicker perception (flicker perimetry) or that exploit the “frequency-doubling” illusion both stress these fast pathways. In flicker perimetry, patients detect light/dark alternations at various frequencies and contrasts. In “frequency-doubling technology” (FDT) perimetry, a grating flickers at high rate (e.g. 25 Hz), creating an illusion of doubled spatial frequency; this preferentially stimulates the parasol (M) ganglion cells in the retina.
Studies have shown that glaucoma affects high-frequency flicker sensitivity. Early work by Tyler reported that many glaucoma patients (and ocular hypertensives) had deficits for rapid flicker (webeye.ophth.uiowa.edu). Later reviews noted that aging also reduces high-frequency flicker vision, but even after accounting for age, glaucoma patients show a robust reduction in flicker sensitivity (webeye.ophth.uiowa.edu). Notably, critical flicker fusion (CFF) perimetry – which finds the highest refresh rate a person can detect – has been found superior to standard white-on-white perimetry in detecting glaucomatous damage (webeye.ophth.uiowa.edu). In other words, testing how fast a light can flicker before blending into steady light can reveal loss of function that normal fields miss.
FDT perimetry is already used clinically as a glaucoma screen. Correlation studies show that FDT results align moderately with structural loss: one analysis found FDT sensitivity and OCT-measured RNFL thickness were significantly correlated (Spearman r≈0.65 across all glaucoma patients) (pmc.ncbi.nlm.nih.gov). In practice, FDT is quick (a screening test takes a few minutes per eye) and has demonstrated good early-detection ability.
More recent “Matrix FDT” devices use full thresholding and can track progression. A prospective study followed ocular hypertensive/glaucoma-suspect eyes for ~3 years with Matrix FDT and conventional perimetry. It found that more eyes developed visual field defects on FDT (8.0%) than on standard testing (6.2%) (jamanetwork.com). Importantly, the study concluded that FDT often detected defects that were not evident on SAP at the same visits (jamanetwork.com). In summary, temporal contrast tests (flicker/CFF/FDT) are sensitive to early glaucoma and provide a complementary view of vision loss.
Mapping Functional Loss to Structure (OCT/OCT-Angio)
Structural OCT imaging of the retina and optic nerve has revolutionized glaucoma care. Retinal Nerve Fiber Layer (RNFL) thickness and the Ganglion Cell Complex (GCC) in the macula (ganglion cell + inner plexiform layers) are closely linked to functional loss. Studies comparing color perimetry to OCT measures show consistent structure-function matches. For example, in eyes with glaucoma the retinal nerve fiber layer thickness correlated significantly with SWAP results – especially in the inferior quadrant – and overall RNFL thinning paralleled decreases in blue-yellow sensitivity (pmc.ncbi.nlm.nih.gov). In one series, average RNFL thickness had a stronger correlation with SWAP mean deviation (r≈0.39, p=0.001) than with white-on-white perimetry (pmc.ncbi.nlm.nih.gov). This suggests that loss picked up in the SWAP (blue pathway) testing aligns with measurable nerve fiber loss. Similarly, FDT loss has been linked to thinning of RNFL, affirming that parasites damage shows up in OCT structure.
Optical Coherence Tomography Angiography (OCT-A) provides maps of blood vessel density beneath the retina and around the optic nerve. Glaucoma affects retinal blood flow; many studies show reduced capillary density in glaucomatous eyes. In fact, wide-field vessel density measured in the RNFL layer (peripapillary OCT-A) was just as diagnostic for glaucoma as RNFL thickness itself (pmc.ncbi.nlm.nih.gov). For distinguishing glaucoma from healthy eyes, one study found “whole image” RNFL vessel density gave an AUC of ~0.94, similar to the AUC=0.92 for average RNFL thickness (pmc.ncbi.nlm.nih.gov). In other words, both structural loss and vascular loss are telling a similar story. However, macular vessel density (N-fluency in the inner retina) seems less predictive than macular thickness: one large study found GCIPL thickness outperformed macular OCT-A vessel density for separating glaucoma eyes from normals (pmc.ncbi.nlm.nih.gov).
Clinicians can combine these findings: focal field losses on specific color perimetry often correspond to focal thinning or perfusion drop on imaging. For example, an inferior arcuate defect on SWAP usually matches superior RNFL thinning on OCT. OCT-A can add further detail – areas of capillary dropout often align with the most damaged sectors of the nerve. Overall, targeted perimetry abnormalities flag regions to scrutinize on OCT.
Predicting Standard Field Decline
A key question is whether these specialized tests can predict future loss on conventional white-on-white fields. If so, they would be especially useful in glaucoma suspects. The evidence is mixed. Several long-term studies have looked at whether SWAP or FDT “lead” SAP in conversion to glaucoma. One 5-year study in ocular hypertension found that SWAP preceded SAP conversion in about 37% of cases, was simultaneous in 29%, and failed to convert in 34% (www.dovepress.com). In practice the authors concluded that SWAP and SAP flag different subsets of early glaucoma, so using both can improve detection. Another much larger Dutch study (7–10 year follow-up of >400 eyes) found that SWAP almost never led SAP: only 2 out of 24 eyes showed SWAP conversion earlier, whereas SAP was equal or earlier in the rest (output.eyehospital.nl). The authors concluded SWAP did not generally predict SAP defects, and that SAP remained at least as sensitive for conversion (output.eyehospital.nl). These results suggest that SWAP can catch some early cases (especially in the short term), but it is not a guaranteed early warning in most eyes.
For flicker perimetry the data is a bit more promising. In the prospective Matrix FDT study, new visual field defects appeared on FDT slightly more often than on SAP (8.0% vs 6.2% of eyes) over 3.4 years (jamanetwork.com). The authors noted that FDT did detect some defects not yet seen on SAP (jamanetwork.com). In other words, FDT caught a few cases a bit earlier. On the other hand, long-term predictive studies of frequency-doubling perimetry are limited. One small analysis suggested that rapid worsening on FDT perimetry was associated with faster SAP decline, but this is not yet definitive.
In summary: targeted-color and flicker tests can sometimes signal trouble before standard fields. SWAP may uncover some early losses, especially in the short term, but it does not consistently outrun SAP in all patients (www.dovepress.com) (output.eyehospital.nl). FDT might reveal a modest number of earlier defects (jamanetwork.com) (jamanetwork.com). Therefore, these tests are best seen as complementary. If a targeted test becomes abnormal, it raises concern even if white-on-white is still normal. But a normal color/flicker test does not guarantee stability. Longitudinal studies suggest that both approaches should be used when possible, and field changes confirmed over multiple tests (www.dovepress.com).
Practical Testing Protocols
Because these specialized tests can be lengthy or fatiguing, protocols must balance thoroughness with patient comfort. Key strategies include limiting the number of tests per visit, using faster algorithms, and tailoring the field scope. In practice, examiners often alternate tests across visits to avoid overloading patients. For instance, one eye’s SWAP or FDT test might be done on one day, and the other on a separate day. Even then, clinicians usually limit sessions to two fields (either two eyes on one type of test or one eye on two modalities) and recommend waiting at least a week before re-testing the same eye on a different test (pmc.ncbi.nlm.nih.gov). This spacing helps avoid confusion from fatigue or learning effects.
Modern perimeters offer faster algorithms (e.g. SITA strategies) that can be used for color perimetry, halving test time. Whenever possible, using a threshold strategy rather than a full-threshold template reduces test duration. Limiting the test area can also help: if a patient has a known deficit (e.g. superior defect), focusing additional colored stimuli in that region will save time versus re-testing the whole field. Larger stimulus sizes (Goldmann size V) are often used in SWAP or flicker tests to improve reliability and speed (webeye.ophth.uiowa.edu).
Patient factors matter too: good lens clarity is essential for color tests (cataract can invalidate SWAP/GYP), so many protocols require lens grading or exclude advanced cataracts. Patients should be well-rested and alert; scheduling these exams at times of day when the patient is attentive can reduce fatigue.
In sum, an effective protocol might look like: Baseline – white-on-white perimetry and OCT. If suspicious or borderline, schedule a color or flicker perimetry (using SITA or short-exam mode). Perform no more than two fields per visit, and allow a week between different tests for one eye (pmc.ncbi.nlm.nih.gov). If a targeted test shows a suspect defect, follow with OCT/OCT-A imaging of that region or more focused perimetry at the next appointment. For screening or busy clinics, it may be practical to alternate specialized tests – for example, do SWAP one year, FDT the next – rather than all tests every year. The goal is to gather pathway-specific data without doubling clinic visits or overwhelming the patient.
Conclusion
Color-specific (blue-yellow, red-green) and contrast-specific (flicker) perimetry enrich our view of visual function by probing the parvocellular, koniocellular, and magnocellular RGC pathways separately. Blue–yellow (SWAP) tests the S-cone/bistratified pathway and often reveals early glaucomatous loss correlating with RNFL thinning (pmc.ncbi.nlm.nih.gov) (pmc.ncbi.nlm.nih.gov). Red–green testing (less commonly used clinically) can expose L/M-cone (midget) pathway deficits; studies have found cases where red-green color vision declines were unexpectedly worse than achromatic losses (www.sciencedirect.com). Temporal/flicker perimetry targets the parasol (M-cell) system and has proven sensitive for incipient glaucoma, sometimes outperforming standard tests (webeye.ophth.uiowa.edu) (jamanetwork.com).
Structural OCT and OCT-A provide an anatomical map to match these functional findings. Regions of color-specific field loss tend to coincide with thinning of the corresponding retinal layers and with microvascular drop-out (pmc.ncbi.nlm.nih.gov) (pmc.ncbi.nlm.nih.gov). While color and flicker tests may predict some impending white-on-white field loss, their performance is not perfectly consistent: some long-term studies found SWAP rarely preceded standard field loss, whereas flicker perimetry showed a slight lead in many cases (output.eyehospital.nl) (jamanetwork.com). In practice, using these tests judiciously – spacing them out, focusing on areas of concern, and confirming any deficits – allows clinicians to capture early or pathway-specific damage without excessive testing burden (pmc.ncbi.nlm.nih.gov) (pmc.ncbi.nlm.nih.gov).
Incorporating color and contrast perimetry alongside structural OCT/OCT-A offers a multimodal approach. For patients, this means problems might be detected by tests of color or flicker vision even if standard vision still seems normal. For clinicians, the challenge is selecting the right test for each case and managing the added testing time. By following protocols that limit fatigue and redundancy, one can gain the specificity of these tests while keeping exams practical. In the end, SWAP, red/green contrast tests, and flicker perimetry are tools – and like all tools, they work best when used as part of an overall diagnostic strategy that includes imaging and regular follow-up.